|
•
|
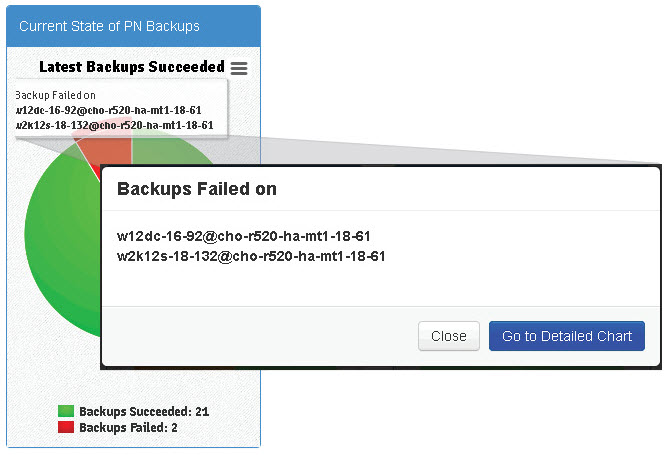
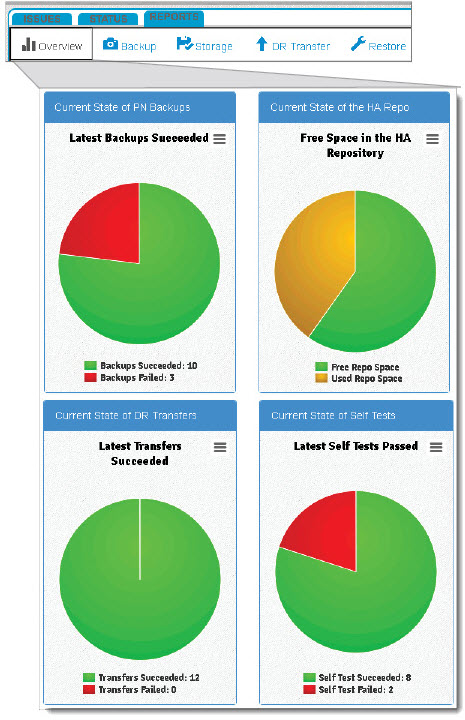
Backups Succeeded Chart. This chart displays whether the most recent (last) backup for every enrolled PN was successful or not. If, for example, 21 backups out of 23 were successful, the success rate is 91%. Simply hover‑over or double‑click on the pie chart to retrieve a list of the PNs that correspond to the backup failures.
 |
|
•
|
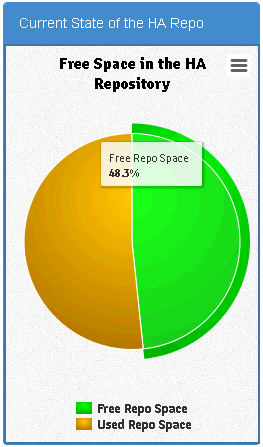
Free Space in Repository Chart. This chart displays the current percentage of both free and used disk space in the snapshot repository. In case of a multi‑tenant HA Appliance, the chart displays the sum of the free space on each snapshot repository and the sum of the used space on each snapshot repository Hover‑over text provides you the percentage of free and unused space
 . |
|
•
|
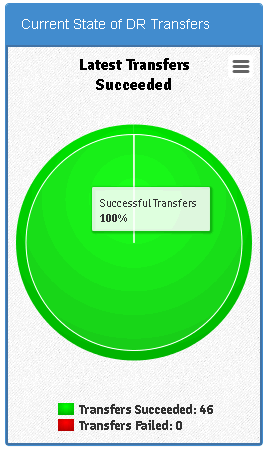
DR Transfers Succeeded Chart. This chart displays whether the most recent (latest) DR Transfer for every enrolled PN was successful or delayed. If, for example, you have 4 enrolled PNs, the chart displays the aggregation of the latest DR transfer for each of those PNs. If the DR transfer was successful for one of those PNs, but the DR connection was severed for some reason, the DR transfer for the three other PNs will be delayed until the connection is operating; in this case, this chart displays 75% delayed.
 |
|
•
|
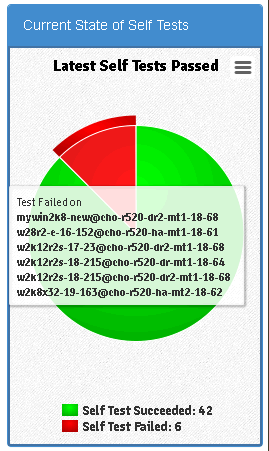
PNs Passing Self Test Chart. This chart displays the most recent (latest) self test that passed for every enrolled PN. If, for example, you have 42 enrolled PNs and 6 of them failed the latest self test, the pass rate is 88%. Simply hover‑over or double‑click on the pie chart to retrieve a list of the PNs that correspond to the self test failures.
 |
|
2.
|
|
•
|
Backup Historical Report. Use this report in conjunction with the knowledge that queued snapshots can occur if the onQ is overly busy backing up other PNs or if the PNs have short backup intervals.
|
|
•
|
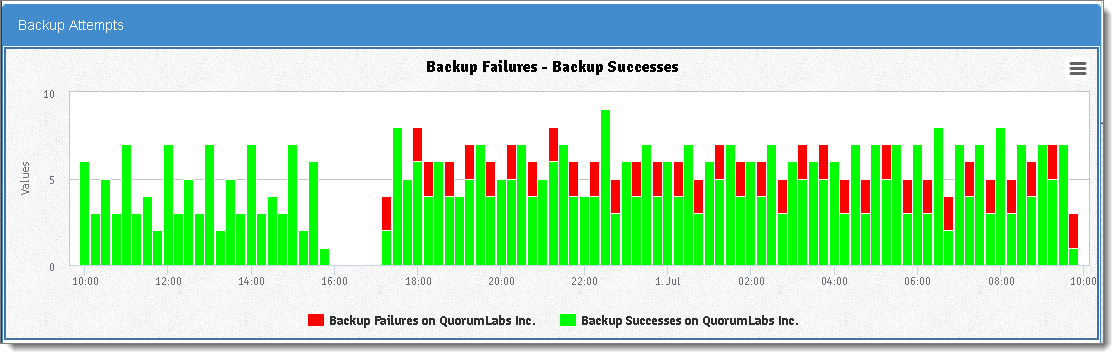
Backup Attempts Graph. This graph shows the total number of backup failures and successes in the time interval that you specified across different instances.
 |
|
•
|
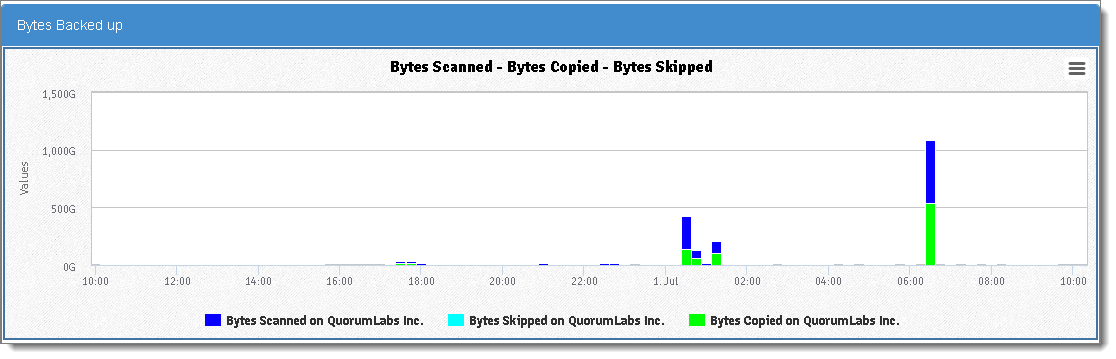
Bytes Backed up Graph. The total number of bytes squirtcopy scanned, copied, and skipped in the time interval that you specified across the different instances. onQ skips bytes/files if instructed to do so as outlined in Edit backup exclude list.
 |
|
•
|
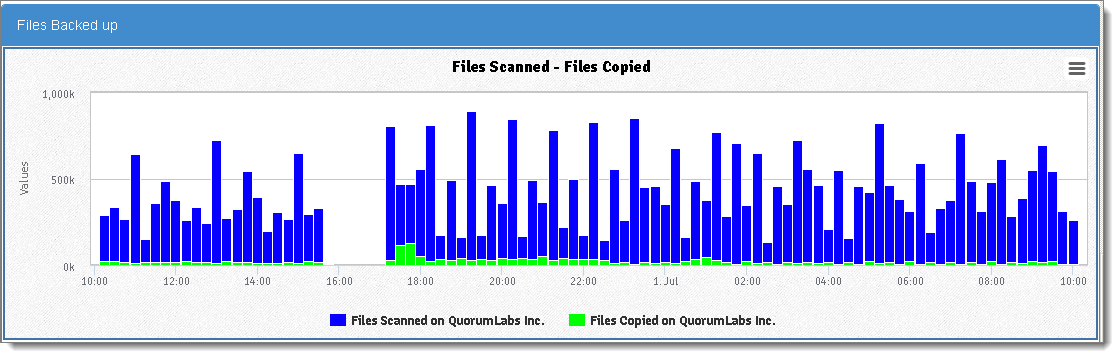
Files Backed up Graph. The total number of scanned files on the PN by squirtcopy and the total number files that squirtcopy copied to the instances and within the time interval that you specified.
 |
|
•
|
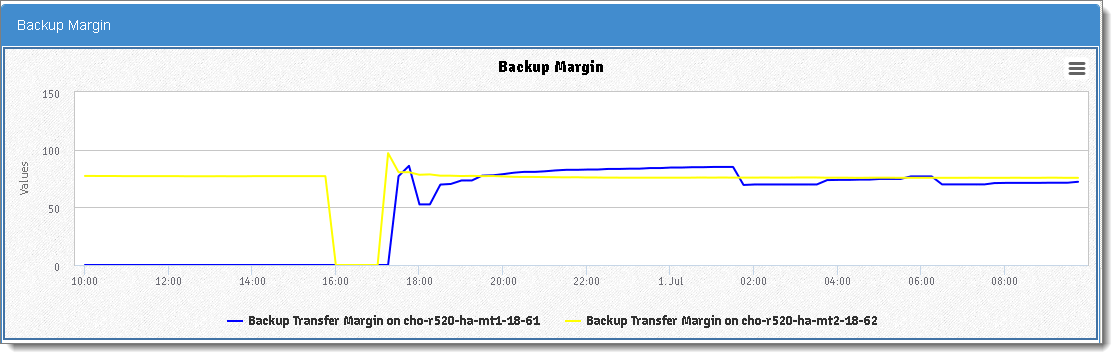
Backup Margin Graph. If the margin value is low, backups are taking longer than expected to complete. This is the same value shown in the HA portal’s Backup Transfer Margin column. You might need to change your backup interval as outlined in Monitor protected nodes and Monitor backups.
 |
|
•
|
Storage Historical Report. Use this historical report to determine if you need to add more snapshot disk space or delete orphan backups manually to free up space.
|
|
•
|
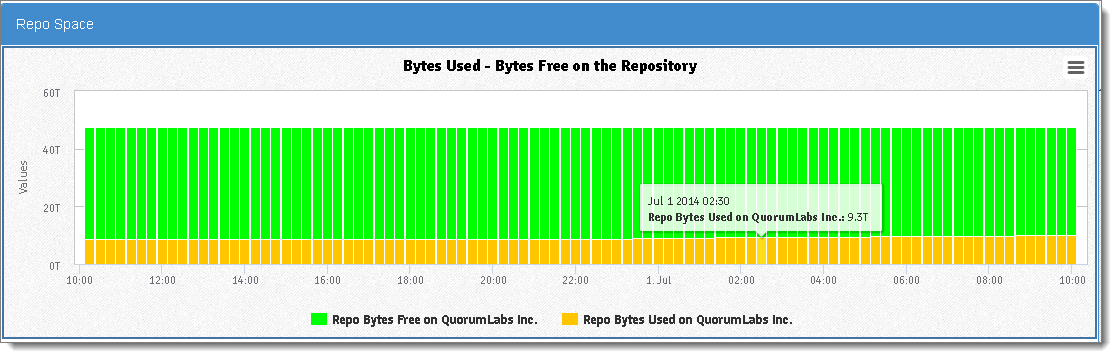
Repo Space Graph. This graph displays the total number of bytes used on the Repository.
 |
|
•
|
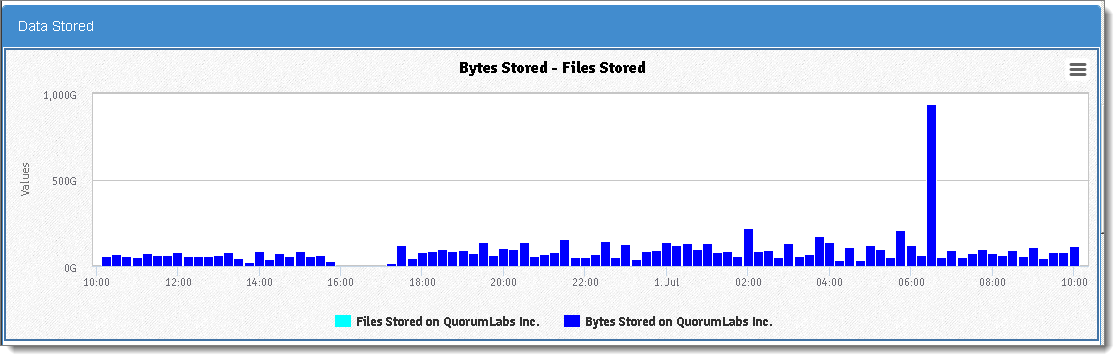
Data Stored Graph. This graph displays the total bytes or files stored in the snapshot repository. The repository is the deduplicated archive of all snapshots of all of your Protected Nodes. From the repository, onQ can reproduce a complete system image from any snapshot.
 |
|
•
|
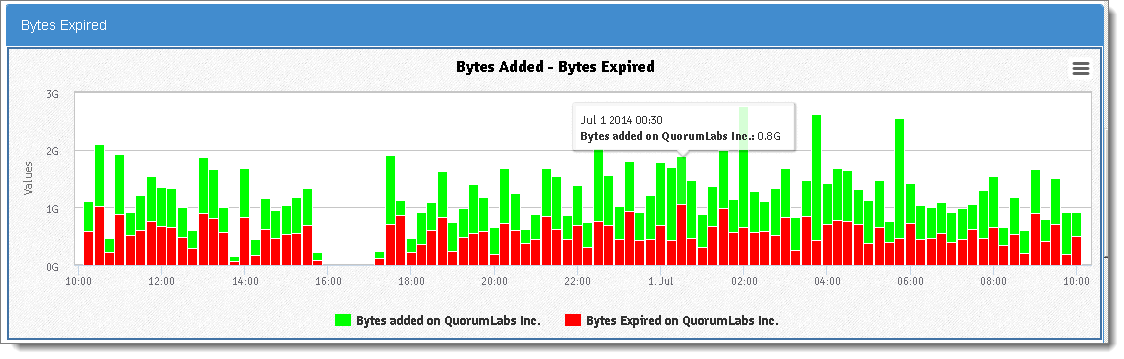
Bytes Expired. When the onQ Appliance was pre‑configured, a specific amount of disk space was allocated to the repository. Moreover, onQ has a built-in policy whereby if its disk space exceeds 85% onQ begins to “free up” space by deleting PN backups, starting with the oldest backups. Files expired and bytes expired values refer to the data (in files and bytes) that onQ expired plus the bytes expired due to the retention period being met.
 |
|
•
|
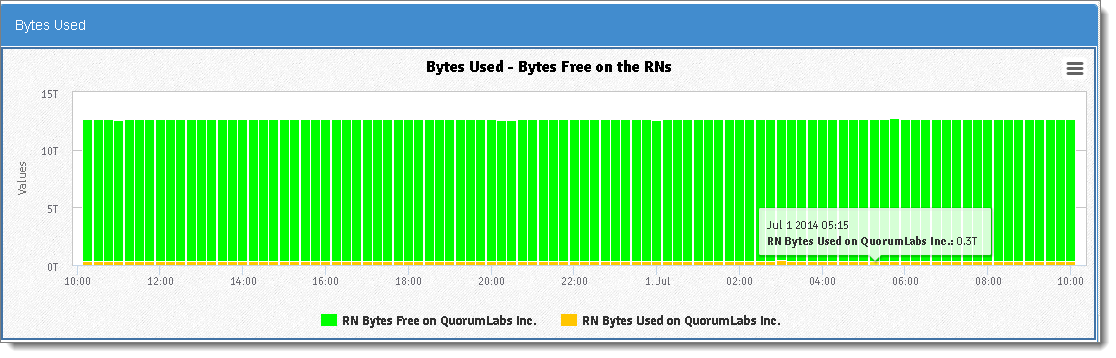
Bytes Used Graph. This graph displays the total number of bytes used on the Recovery Nodes.
 |
|
•
|
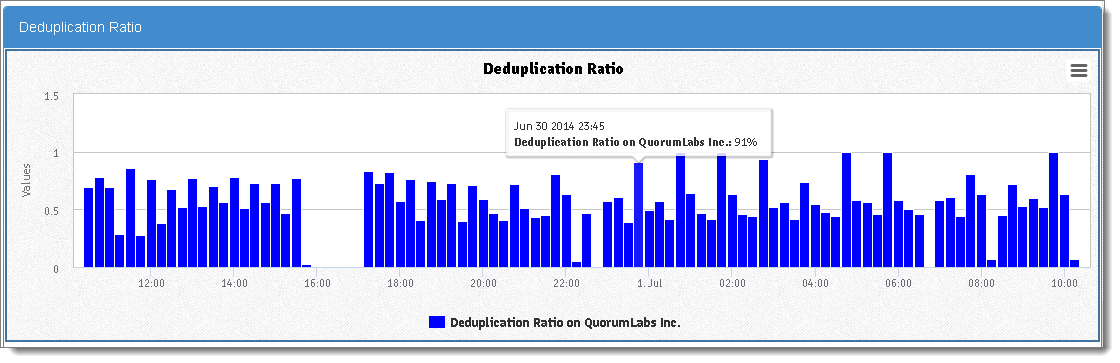
Deduplication Ratio Graph. This graph shows the data compression ratio, which is equal to the total number of bytes copied divided by the total number of bytes added. If your PNs all have the same data, you'll see a better compression ratio then if your PNs have unique data; the latter scenario is indicative of duplicate data on your PNs.
 |
|
•
|
DR Transfer Historical Report. After performing a backup, the HA Appliance transfers this data from the HA Appliance to the DR Appliance. Use this report to help determine whether or not to adjust bandwidth throttling to speed up data transfers.
|
|
•
|
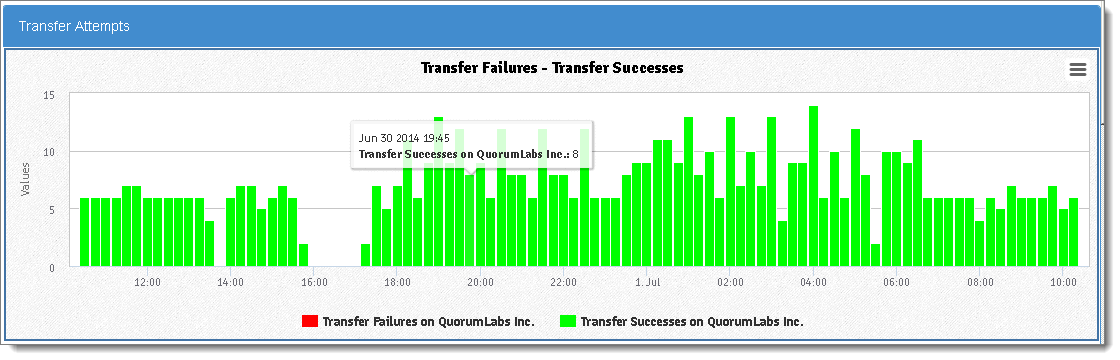
Transfer Attempts Graph. This graph shows the number of HA‑to‑DR or DR‑to‑DRMirror or both transfer attempts and successes in the time interval that you specified and depending on the instances that you choose. For example, if you want to show all HA‑to‑DR transfers, then select the HA Appliances; do not select any DR Appliances.
 |
|
•
|
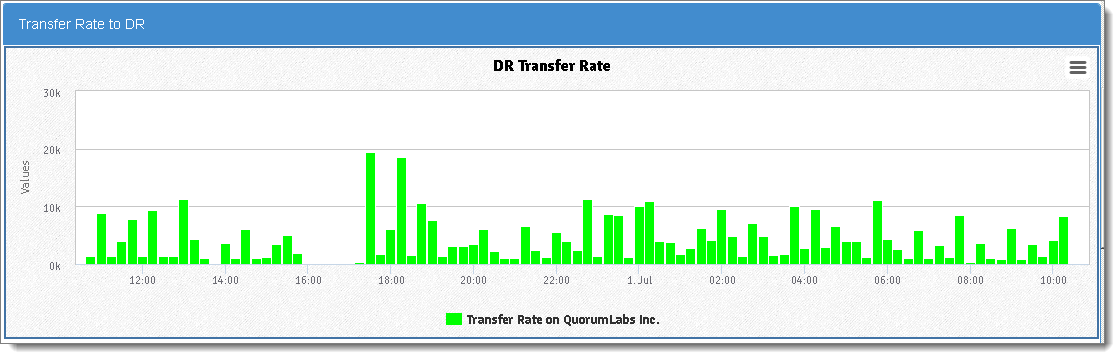
Transfer Rate to DR Graph. This graph shows the transfer rate, in bytes/seconds, for all successful transfers within a time interval that you specified.
 |
|
•
|
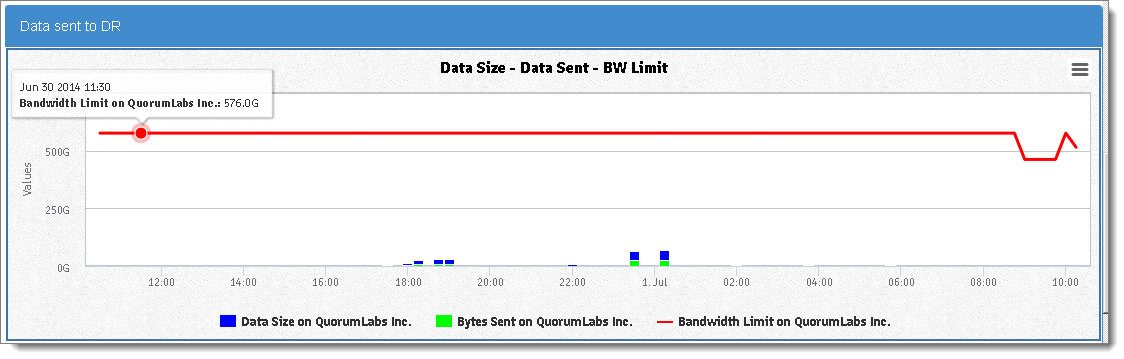
Data Sent to DR Graph. This graph shows the total bytes sent from the HA appliance and the total bytes sent to the DR appliance. The bandwidth limit is the transfer limit at the time of transfer that you defined in the onQ portal.
 |
|
•
|
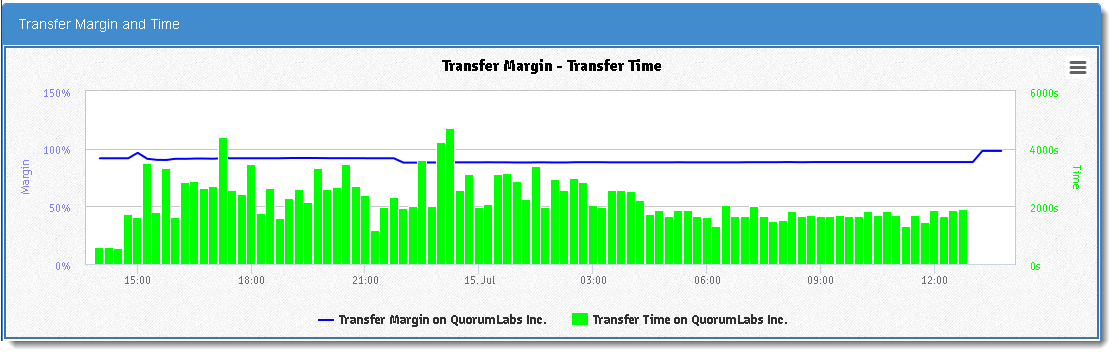
Transfer Margin and Time Graph. If the margin value is low, the transfer is taking longer than expected to complete. This is the same value shown in the HA portal’s Backup Transfer Margin column; for a low transfer margin (see Monitor protected nodes), you might need to modify the backup interval, modify the initial backup time, and adjust bandwidth throttle.
 |
|
•
|
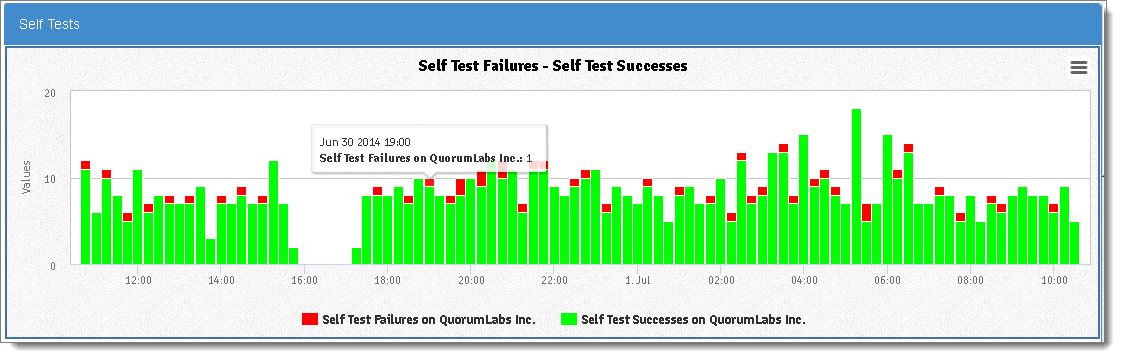
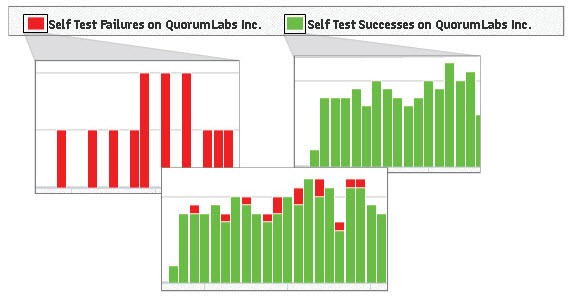
Self Tests Graph. onQ can automatically test (also called Self Test), on a predefined schedule, recovery nodes’ ability to boot properly and can communicate with the onQ Service. This historical report shows the number of self test failures and successes in the time interval that you specified. Use this data to help assess your PN’s vulnerability to disasters.
 |
|
•
|
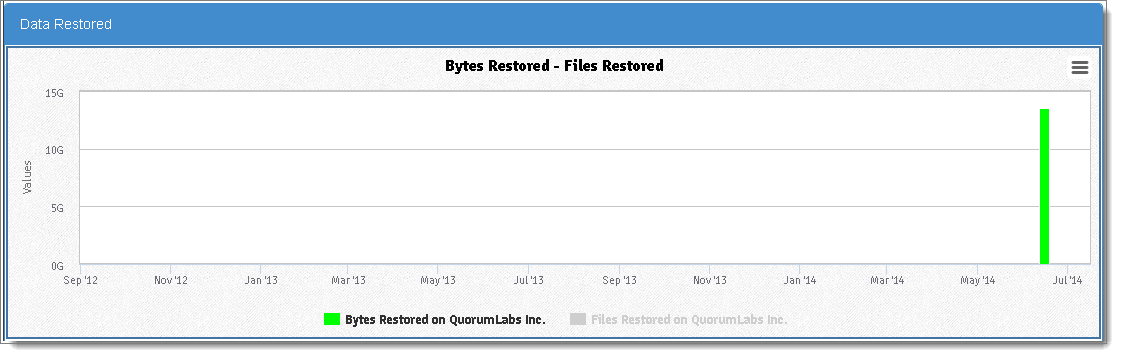
Data Restored Graph. This historical report shows the number of bytes and files restored using FLR. You can use this chart to provide restore statistics for SLA reporting. You can also use this report to verify that the number of files and bytes that you expected to restore matches the files and bytes that were actually restored.
 |
|
•
|
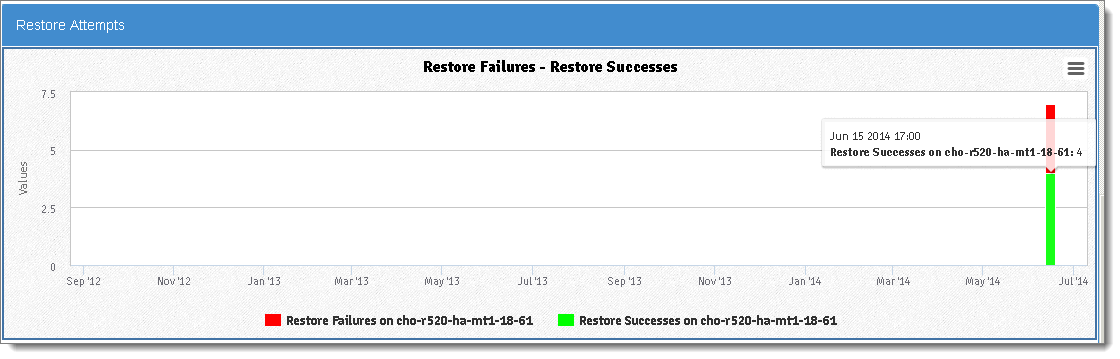
Restore Attempts Graph. This historical report shows the number of FLR restore attempts that failed and succeeded.
 |
|
2.
|
Click on the REPORTS tab.
|
|
3.
|
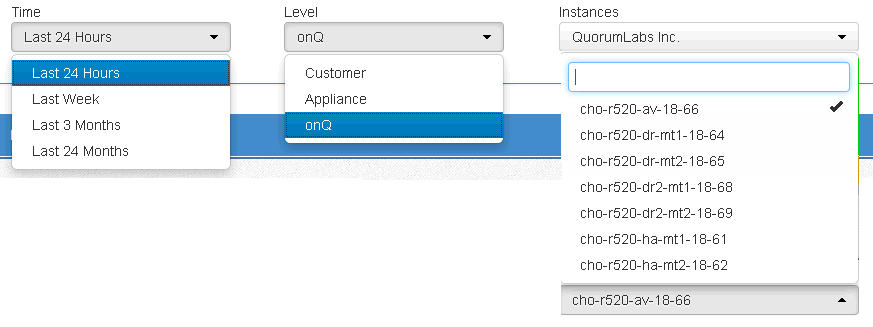
Click on the Backup, Storage, DR Transfer, or Restore subtab. Each of these pages maps to a different Historical Report.
|
|
a.
|
In the Time drop‑down list, specify the time interval that you want to capture. Each time interval displays information in specific reporting increments.
|
|
b.
|
In the Level drop‑down list, specify the entity on which you want to report:
|
|
All of a customer’s onQ Appliances combined. For example, HA and DR. Customer is defined by APPLIANCE CONFIG > ADVANCED > License > Customer field.
|
|
|
One specific onQ Appliance. The onQ Appliance is identified by APPLIANCE CONFIG > HYPERVISOR > Hypervisor Name field.
|
|
|
One specific onQ. In the case of a multi-tenant environment (DASHBOARD tab > onQ STATUS page > Configuration field), one onQ Appliance can have many onQs. The onQ is identified by the onQ Manager hostname (aka Manager hostname or onQ hostname) as shown in DASHBOARD tab > onQ STATUS page > Manager hostname field.
|
|
|
c.
|
In the Instances drop‑down list, select the specific Customer(s), Appliance(s), onQ(s), or PN(s) that you want included in your report.
|
|
5.
|
Click Update Chart.
|
|
7.
|
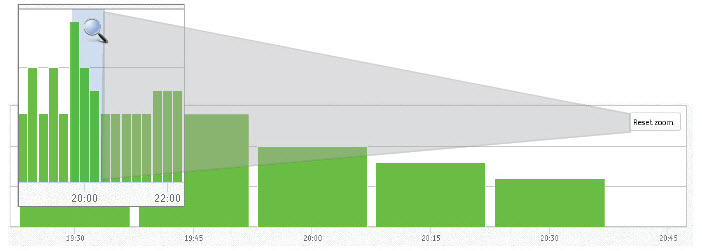
(Optional) Zoom in on a subset of data by highlighting a section of the timeline. Click the Reset Zoom button when you’re done to return to the entire report.
 |